Certificate Achievement Unlocked: How does MOOC learners’ behaviour change?
Author: Yue Zhao, Dan Davis, Guanliang Chen, Christoph Lofi, Claudia Hauff and Geert-Jan Houben Affiliation: Lambda Lab, Web Information Systems, TU Delft
Abstract
Massive Open Online Courses (MOOCs) play an ever more central role in open education. However, in contrast to traditional classroom settings, many aspects of learner/user behavior in MOOCs are not well researched. In this work, we focus on modelling learner behavior in the context of continuous assessments with completion certificates, the most common assessment setup in MOOCs today. Here, learners can obtain a completion certificate once they obtain a required minimal score (typically somewhere between 50-70%) in continuous tests distributed through the duration of a MOOC.
In this setting, the course material or tests provided after “passing” do not contribute to earning the certificate, thus potentially affecting learner’s behavior. Therefore, we explore how “passing” impacts MOOC learners: do learners alter their behaviour after this point? And if so how? While in traditional classroom-based learning the role of assessment and its influence on learning behaviour has been well-established, we are the first to provide answers to these questions in the context of MOOCs, providing valuable insights which can be used to design better courses in the future. As a result, we present a set of core behaviour patterns based on our extensive exploratory analysis of the log traces of more than 4,000 certificate-earning learners across four edX MOOCs.
Research Questions
We address two Research Questions in this work:
RQ 1: Do MOOC learners behave differently after clinching a passing grade?
RQ 2: What are the core behaviour patterns of MOOC learners before and after passing, and how can learners be classified?
MOOC Dataset
We analyze the log traces of 4,000 learners who successfully completed one of four MOOCs offered on the edX platform – they are summarized as following:
| ID | Name | Start | End | Units | Videos | Questions | Attempts | Registered | Engaged | Passed | Compl Rate |
|---|---|---|---|---|---|---|---|---|---|---|---|
| FP | Introduction to Functional Programming | 10/2015 | 01/2016 | 8 | 39 | 285 | 1 | 25,188 | 9,900 | 1,143 | 4.54% |
| DA | Data Analysis: Take It to the MAX() | 09/2015 | 11/2015 | 8 | 60 | 137 | 2 | 23,813 | 9,780 | 1,156 | 4.85% |
| SEW | Treatment of Urban Sewage | 04/2016 | 06/2016 | 7 | 79 | 36 | 1 | 11,006 | 2,589 | 361 | 3.28% |
| SE | Solar Energy | 09/2015 | 12/2015 | 8 | 61 | 128 | 1 - 3 | 26,718 | 12,723 | 1,346 | 5.04% |
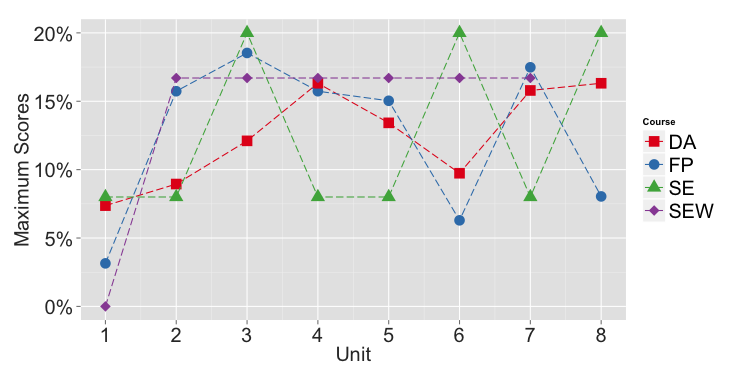
As the distribution of possible scores shows in Fig.1 (and with $\tau_{pass}=58%$ and $\tau_{pass}=60%$ in mind), all four MOOCs can be passed well before the final unit.
 |
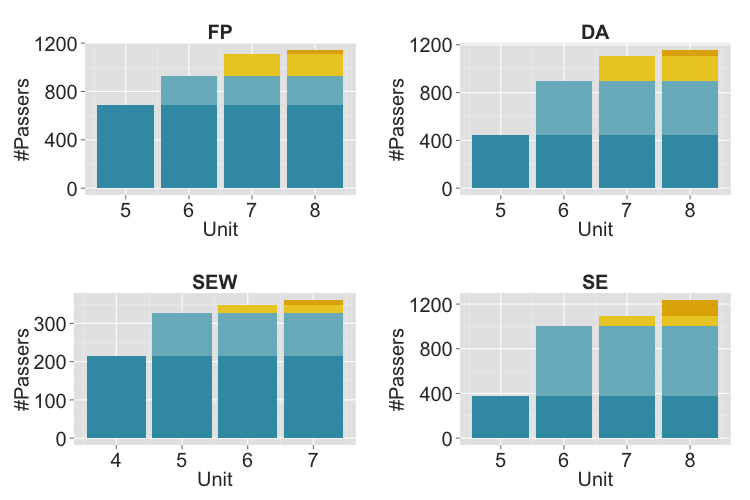
In Fig.2 we plot the total number of learners who earned a certificate by the end of each (weekly) unit — starting at the first possible certificate-earning unit.
 |
Pre-/post-passing Behaviour
Observation Analysis
The distribution of quiz scores and video consumption for our learners grouped by passing unit are shown in Fig.3 and Fig.4
|
FP 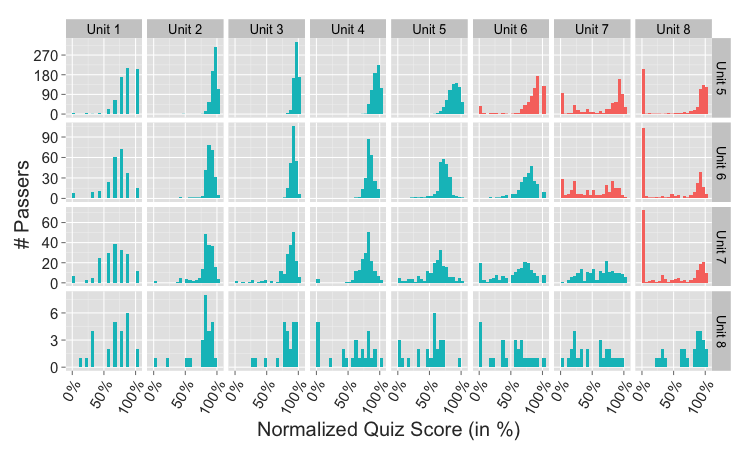
|
|
DA 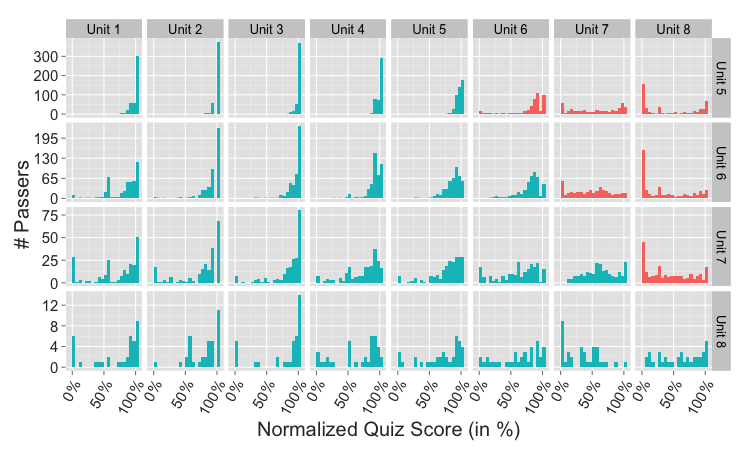
|
|
SEW 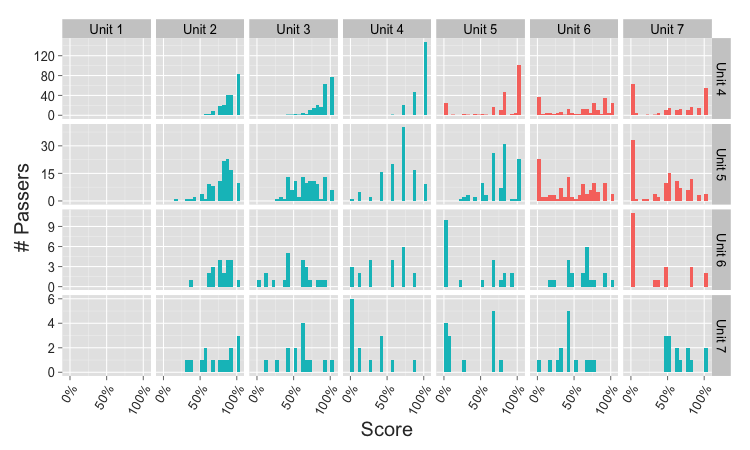
|
|
SE 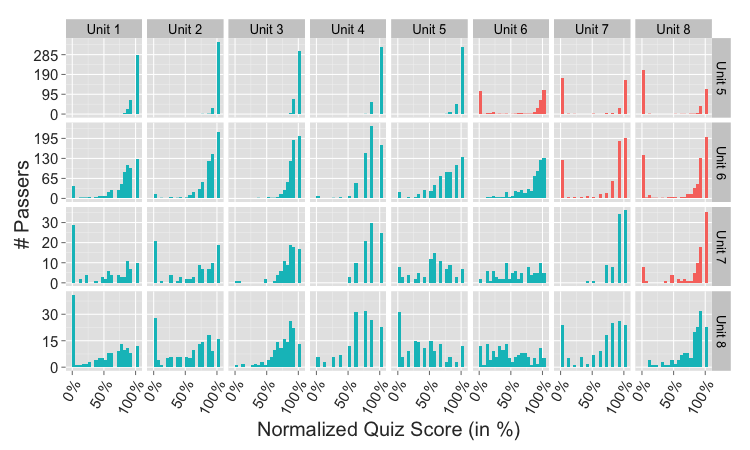
|
|
FP 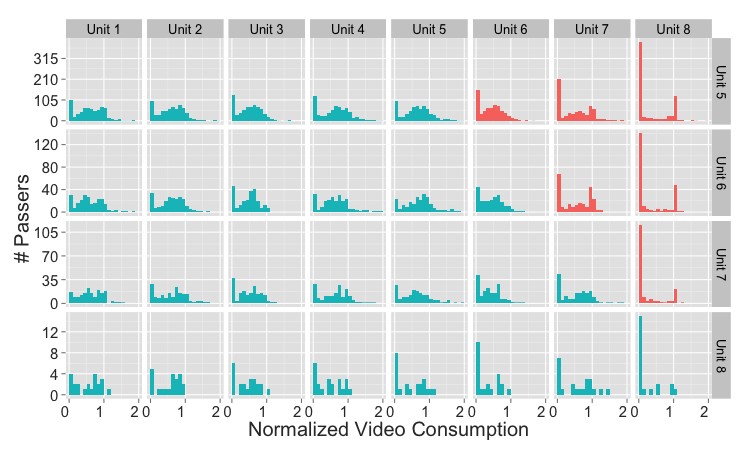
|
|
DA 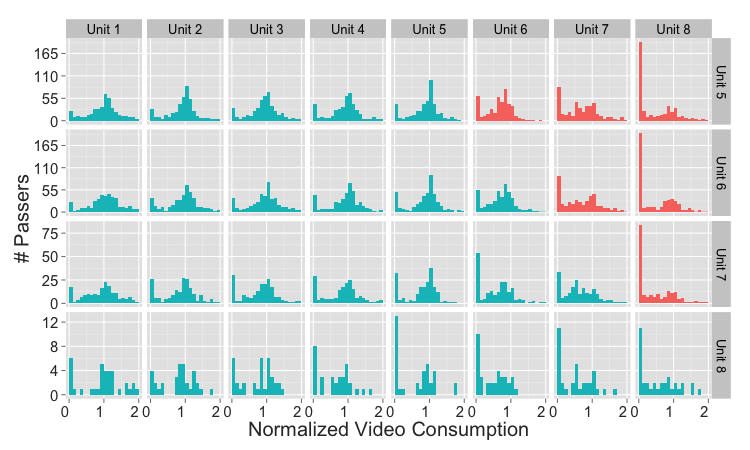
|
|
SEW 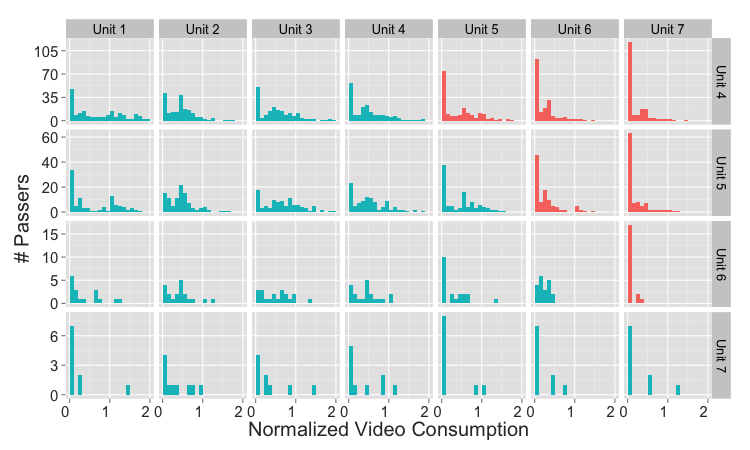
|
|
SE 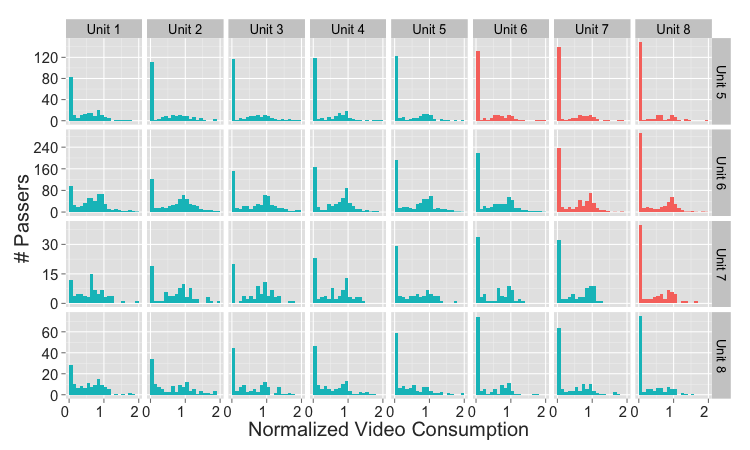
|
Clustering Analysis
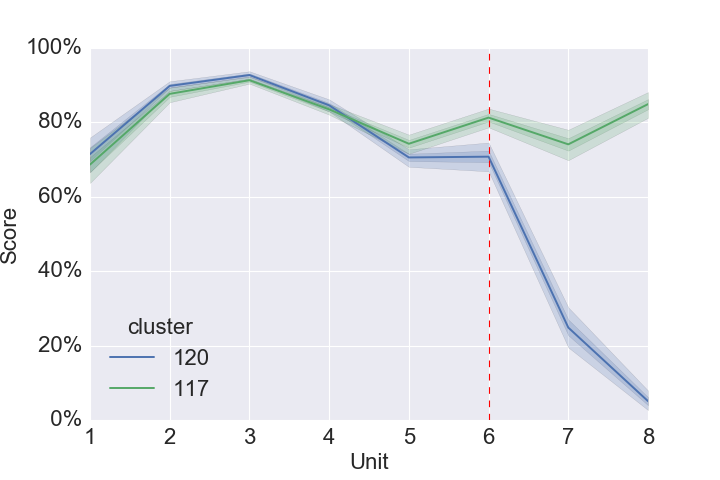
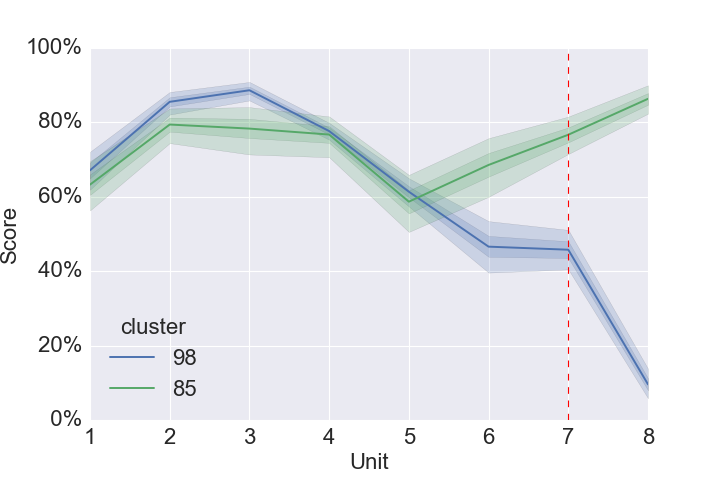
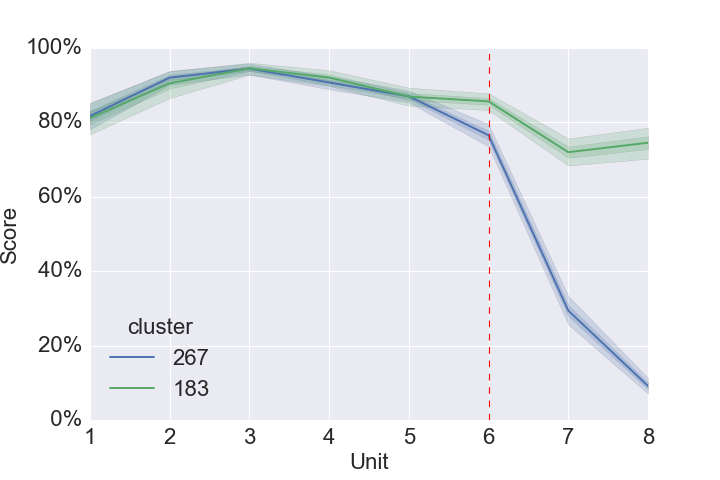
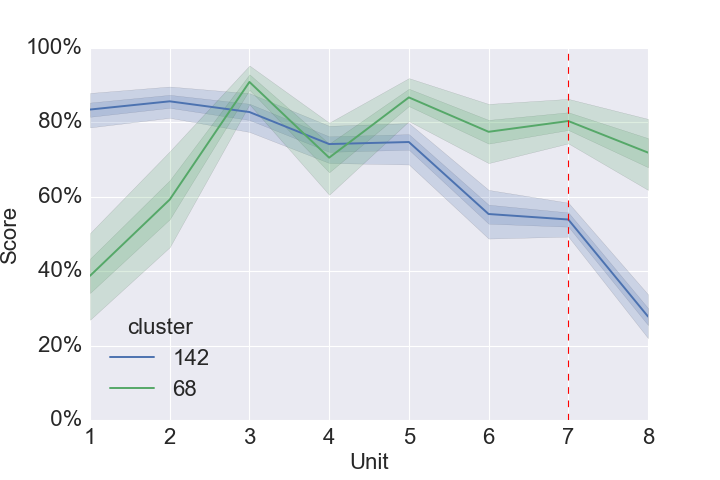
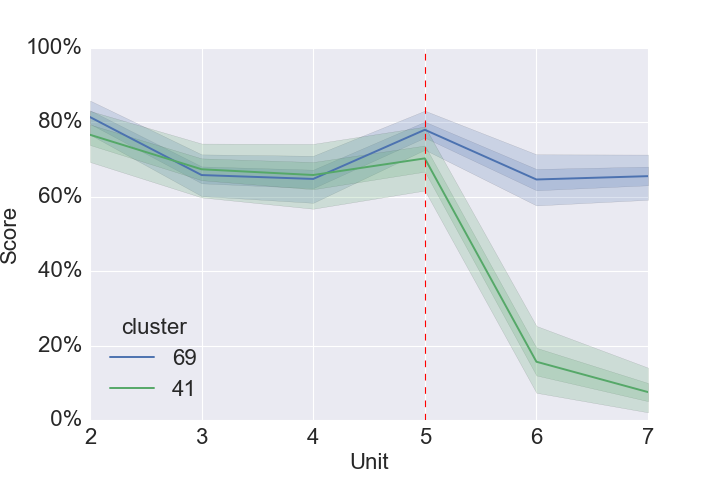
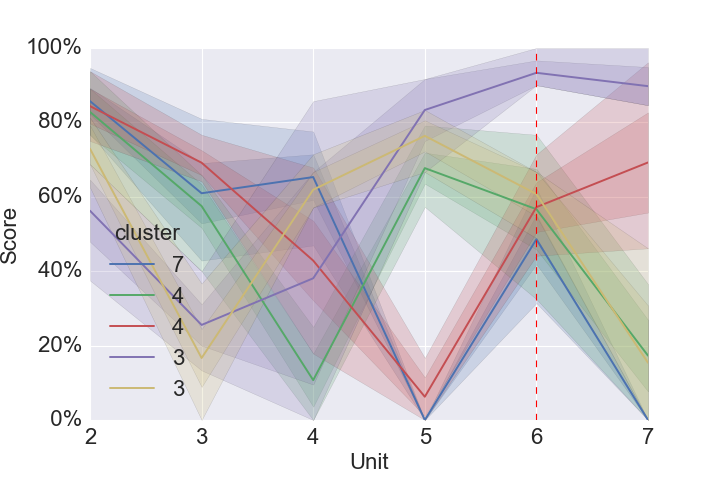
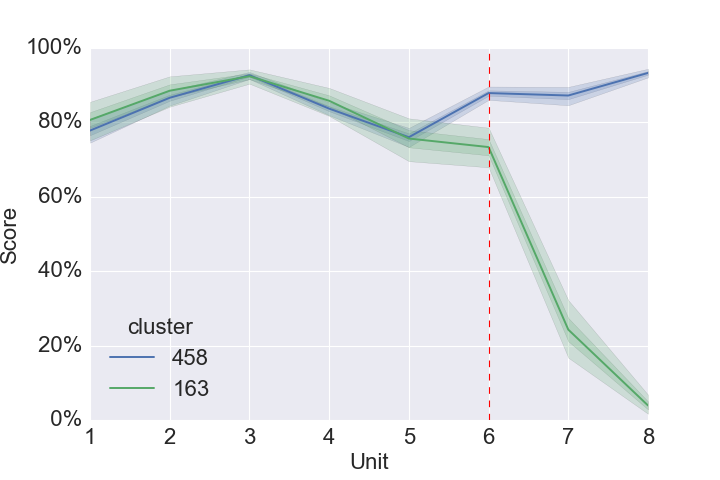
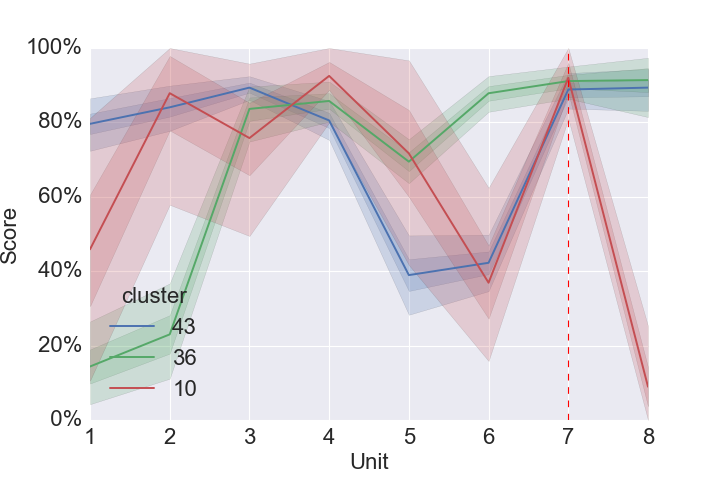
We visualize the resulting normalized quiz score clusters in Fig.5 for the four courses: each unit in each cluster is represented by the average score learners in that cluster achieve in that unit with their respective confidence bands.
|
FP (Unit 5, 6, and 7) 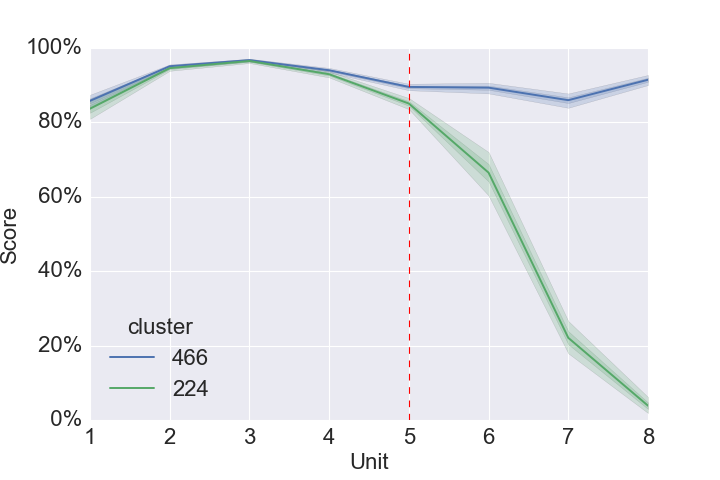
|
|
DA (Unit 5, 6, and 7) 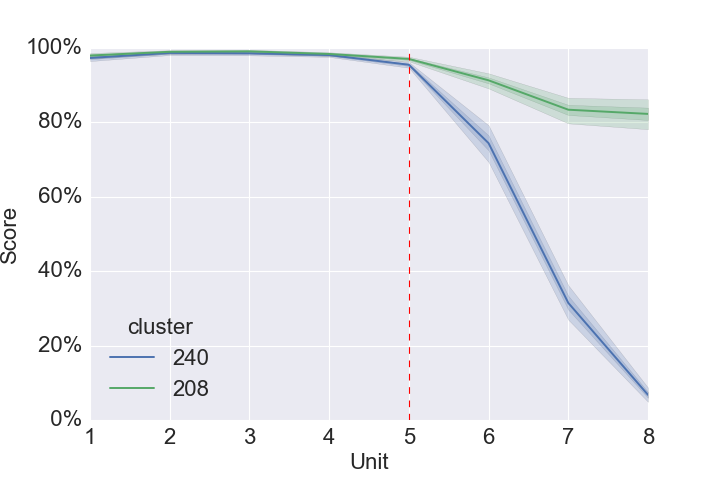
|
|
SEW (Unit 4, 5, and 6) 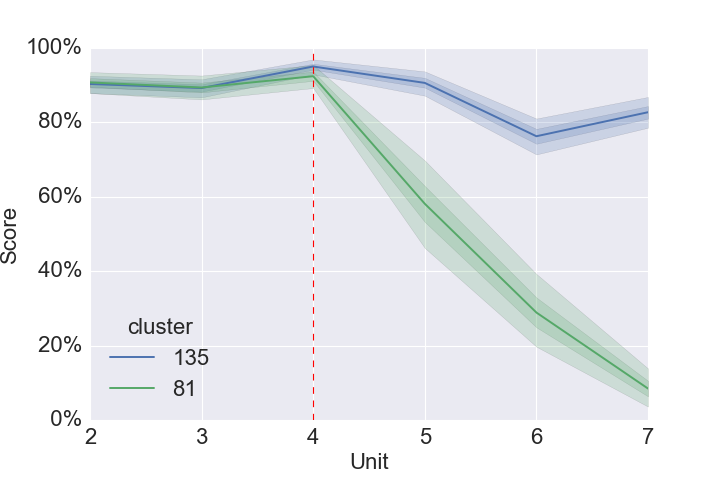
|
|
SE (Unit 5, 6, and 7) 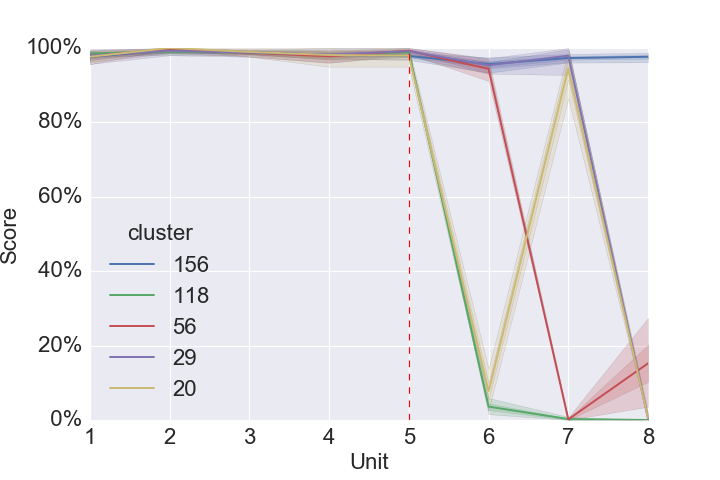
|
Learners’ Behaviour Pattern
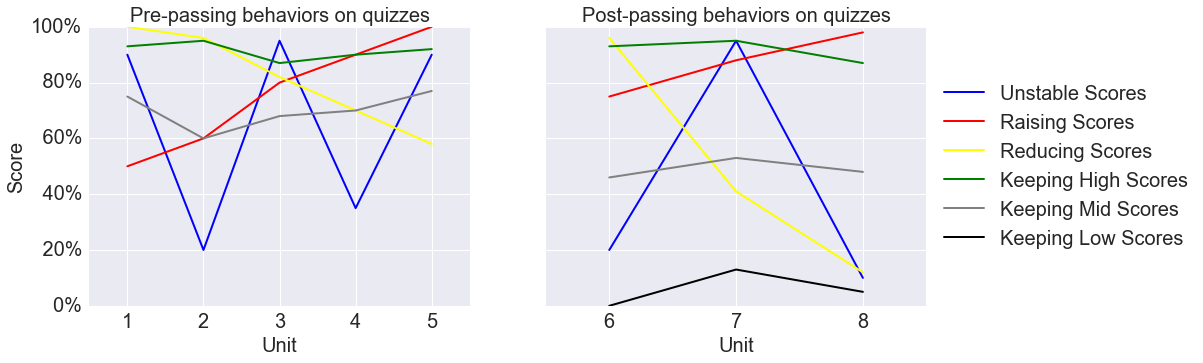
In addressing RQ2 we now conceptually define a number of behaviour patterns (shown in Fig 6, based on the literature and our own findings) and then classify our passers into their closest matching pattern.
 |